Querying Azure Digital Twins with PowerBI

Heads up! This information might be outdated since it was last updated over a year ago. Please double-check the information before relying on it.
A Digital Twin is a digital replica of a physical object, space, or abstract process. It allows us to model the state of these things virtually, and then respond to events as they happen in real time.
Microsoft provide an Azure Digital Twin service, which allows us to create pre-defined models (such as thermostats for example) and then create twins based on these models, mapping the relationships between a whole series of different things.
What is Azure Digital Twins? - Azure Digital TwinsOverview of what can be done with Azure Digital Twins.Microsoft Docsbaanders![]() As well as SDKs across a variety of languages from .NET to Python, Microsoft have created a number of tools and code samples - the Azure Digital Twins explorer is a web based application that allows you to visually see the connections between these twins.
TODO: Update social tile.
As well as SDKs across a variety of languages from .NET to Python, Microsoft have created a number of tools and code samples - the Azure Digital Twins explorer is a web based application that allows you to visually see the connections between these twins.
TODO: Update social tile.
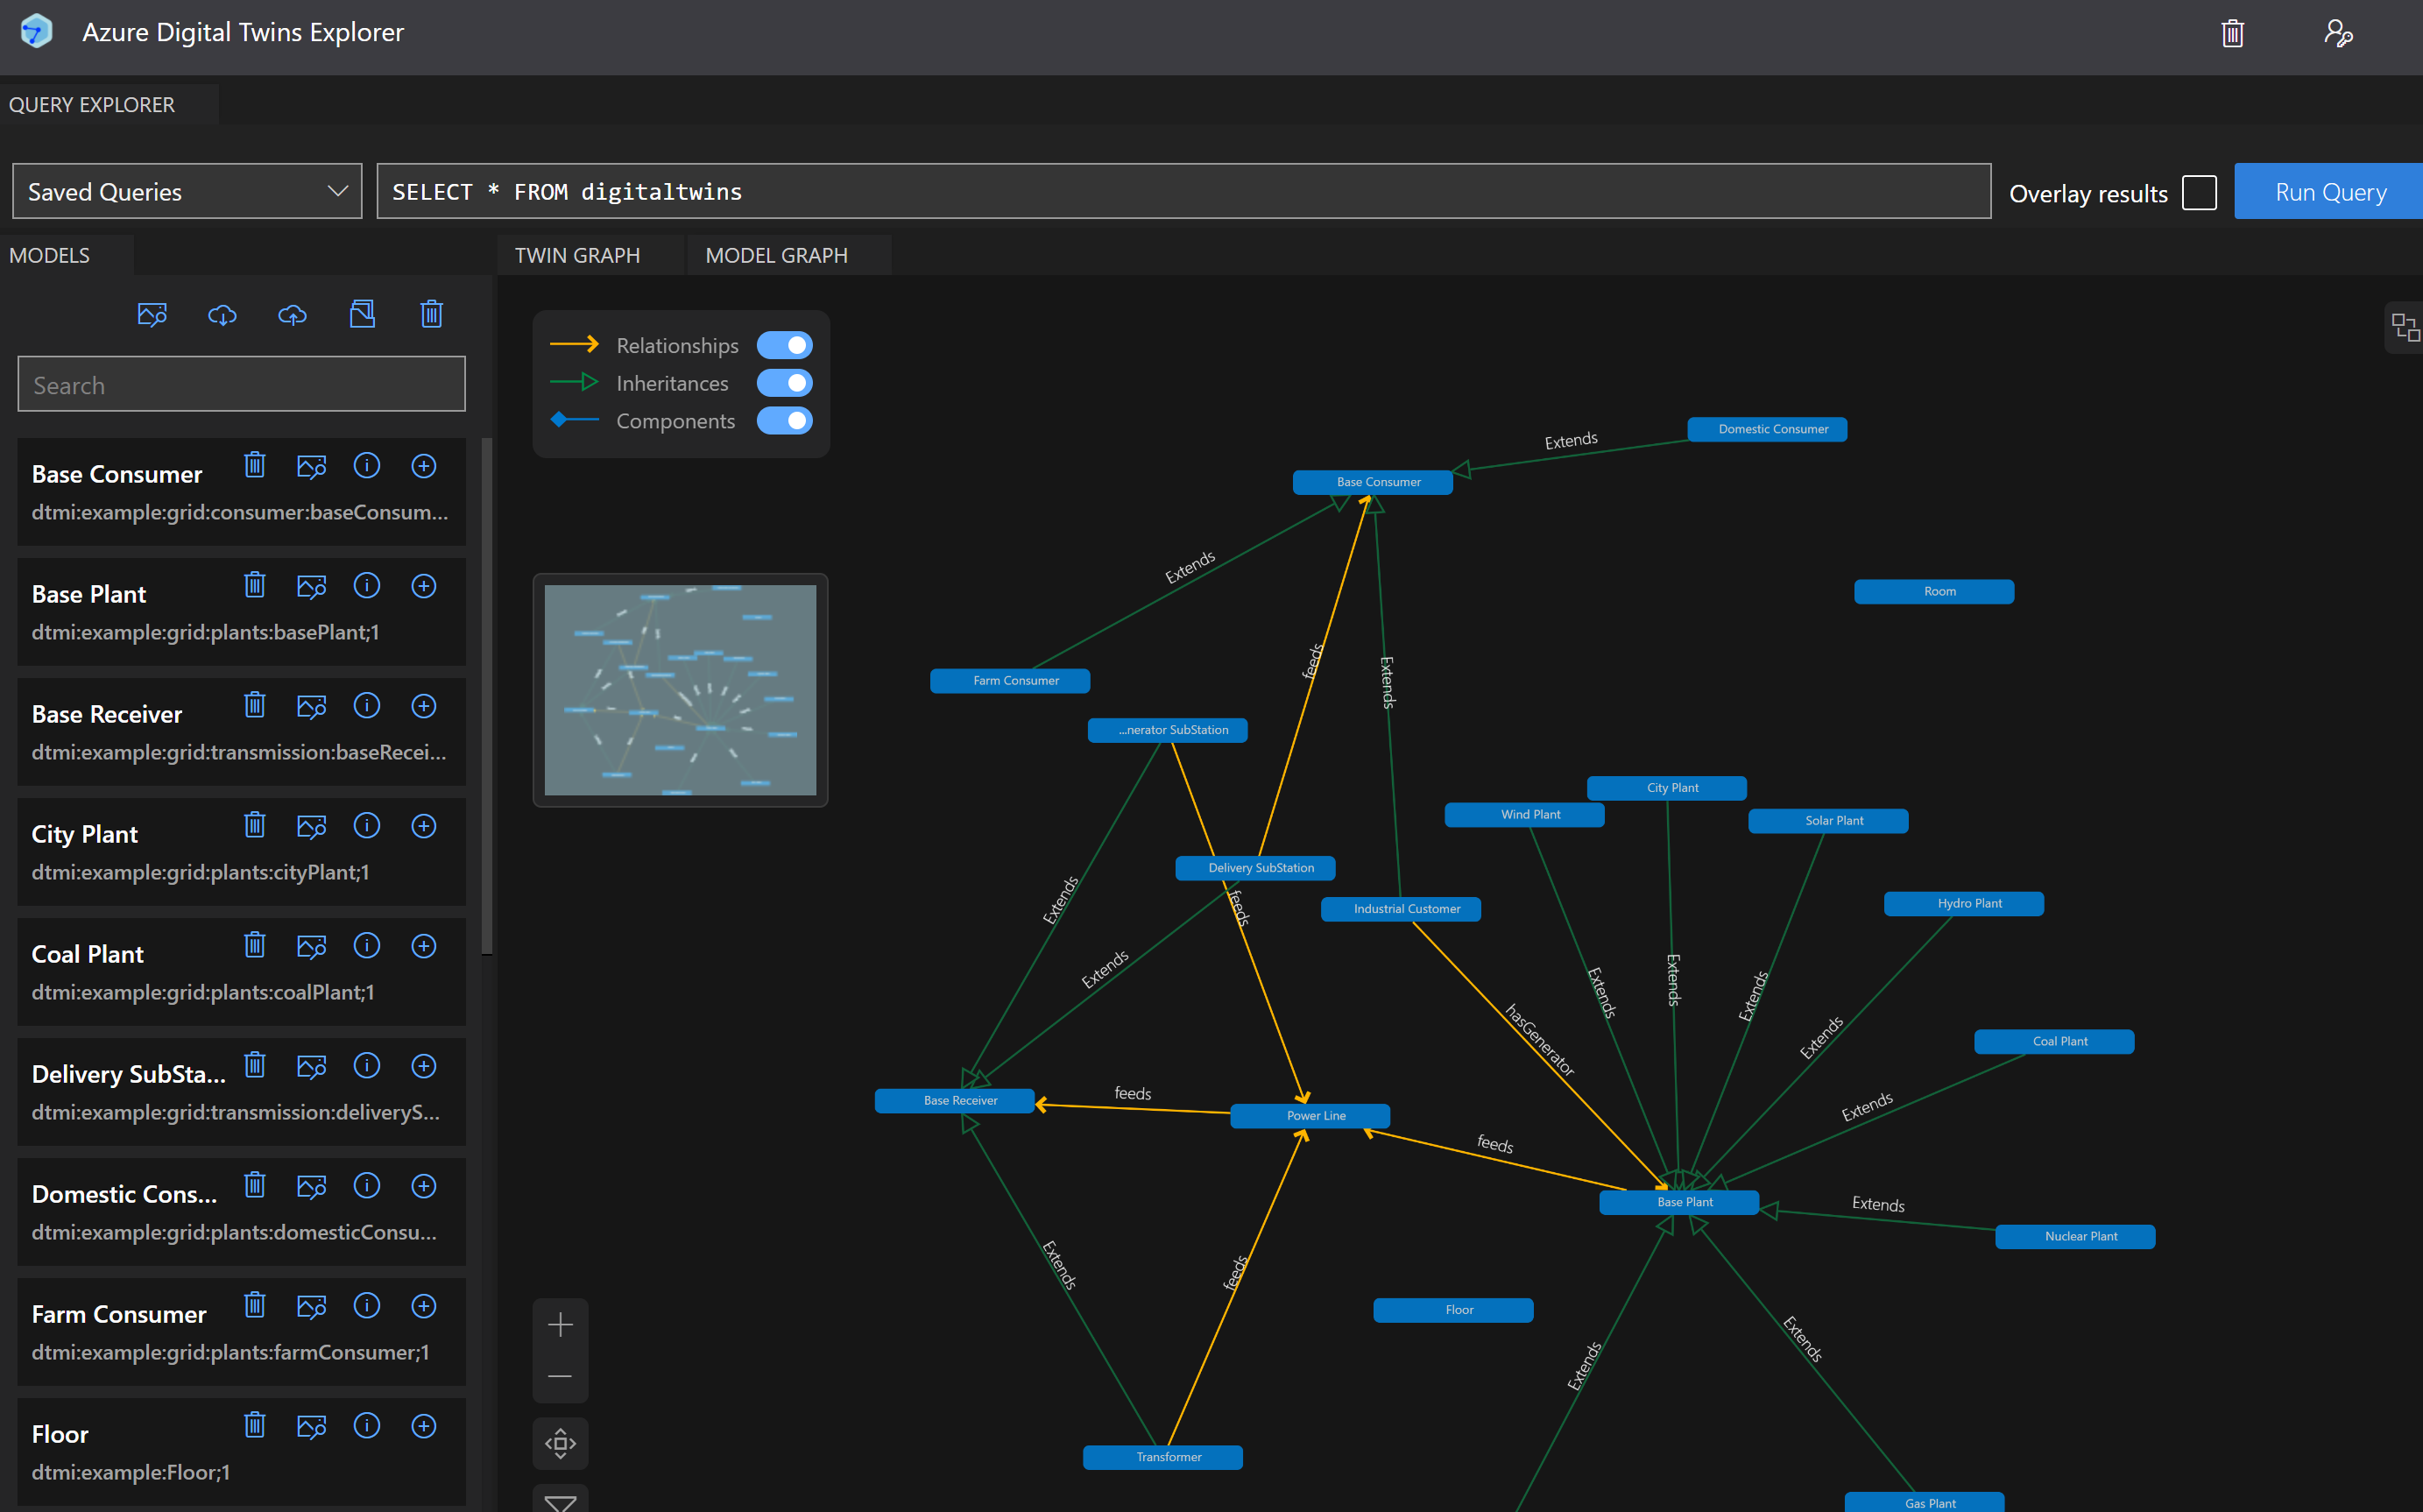 A screenshot of the graph database within the Azure Digital Twins explorer### Sharing data with end users
TODO: Update caption.
Sharing these views with end users can be difficult however - you probably don’t want to be sharing the explorer with end users! And what if you want to share an overview of the current situation with your business users? Well, this sounds like a perfect use case for PowerBI and Azure Digital Twins.
A screenshot of the graph database within the Azure Digital Twins explorer### Sharing data with end users
TODO: Update caption.
Sharing these views with end users can be difficult however - you probably don’t want to be sharing the explorer with end users! And what if you want to share an overview of the current situation with your business users? Well, this sounds like a perfect use case for PowerBI and Azure Digital Twins.
PowerBI to the rescue
PowerBI is the visualisation tool from Microsoft that allows you to create and share pre-built reports and data visualisations - niftily, you can use the output of Python scripts as a data source, allowing us to use the Azure Digital Twins SDK to create a PowerBI data source.
Sealjay-clj/powerbi-adtQuerying Azure Digital Twins with PowerBI. Contribute to Sealjay-clj/powerbi-adt development by creating an account on GitHub. GitHubSealjay-clj
### How do I pull my twins into PowerBI?
TODO: Update social tile.
Using the
azure-digitaltwins-core python package, this can be done in eight steps!
- Create an Azure Digital Twin, or use one you already have.
- Give yourself access to the data plane - adding some example data - the Azure Digital Twins explorer example data is a good start.
- Create a virtual environment for your Python setup, e.g.
python3 -m venv .venv. - Install the requirements
pip install -r requirements-dev.txt. - Copy the path to your virtual environment.
- Enable python scripting in PowerBI.
- Log in to Azure on the CLI with
az login. - Import the powerbi-query.py file in the GitHub repository as a PowerBI datasource.
query_expression = "SELECT * FROM digitaltwins"
query_result = service_client.query_twins(query_expression)
twin_list = pd.DataFrame(query_result)
And there you have it. The example query I provide will allow you to query the twin graph - and you can use the Azure Digital Twins query language to build on this. Each individual pandas dataframe will appear as a data set.
How could you extend this?
So, next time you want to share data from Azure Digital Twins - consider PowerBI! You could use the Anomaly Detector Cognitive service for example, in combination with PowerBI, to look for buildings that are too hot, too humid, or too cold, and colour code this accordingly.
For a full example, you can see the repository on GitHub.
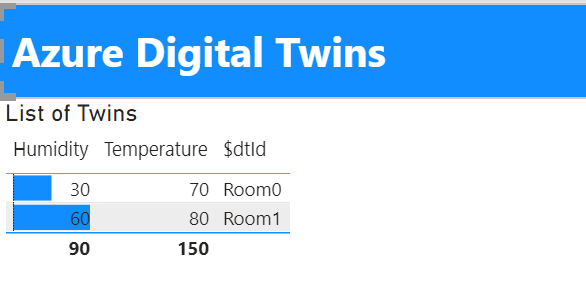 The list of twins displayed in PowerBI
TODO: Add caption.
The list of twins displayed in PowerBI
TODO: Add caption.